The main aim of the first edition of the collection of maps entitled Changing Ethnic Patterns of the Carpatho–Pannonian Area was to present – as a summary of the ethnic map series begun in the 1990s – the ethnic structure of the Carpathian Basin and its neighbourhood in a uniform manner. While retaining this feature, the present third edition contains significant changes in comparison with the first two versions. The most important of these is the updating of the publication and the integration of the latest census data (from 2011) for the region. The state of affairs in 2011 is not only shown on the maps; the accompanying text (an object of study in its own right) places special emphasis on revealing ethnodemographic processes since 2000. Beyond expanding and improving the text and the database, we have georeferenced our main map, facilitating spatial comparisons with other coordinate maps. Where possible, we have also updated the administrative divisions of the various countries in line with the administrative changes of the past decade. In view of all these changes, the atlas will be of interest not only to new scholars of our region but also to those who are familiar with the previous editions.
1.1. The study area (Carpathian Basin, Carpatho–Pannonian area)
The name of the area under study has altered several times in recent centuries in accordance with changes in the political situation and in the national borders. Until the end of World War I the entire Hungarian settlement area belonged to the Hungarian state, and the area now referred to as the Carpathian Basin was called the Kingdom of Hungary, the Hungarian Empire, Countries of the Hungarian Holy Crown, or simply Hungary (Hunfalvy 1863; Ballagi–Király 1878; Balbi–Czirbusz 1899; Cholnoky 1918). After the Treaty of Versailles (Trianon, 1920), some Hungarian geographers interpreted, with irredentist intent, the name “Hungary” as they had before 1918, ignoring the changes in the national boundaries. Soon, however, the search began for a geographic synonym that would be accepted internationally. Teleki (1923, 1934) proposed the term Central Danubian Basin, Cholnoky (1929) the Hungarian Basin, Bendefy-Benda (1932) the Carpathian Basin, and Kalmár (1932) the Carpathian or Central Danubian Basin.
The name Carpathian Basin, named after the mountains at the edge of the study area, was also used by Bulla–Mendöl (1947), and it has become widely accepted in Hungarian society. In this sense it is not only a physical geographic term, but also a synonym for the historical Hungarian state territory and for the regions inhabited – at least in part – by Hungarians. Consequently, it is also a geopolitical term. Obviously, Hungary’s neighbours refer to this area not in this way, but in a physical geographical sense, dividing it into two areas: the Carpathian Mountains and the Pannonian (Central Danubian, Tisza–Danube) Basin. Since the present atlas shows not only the area of the Carpathian Basin but also its neighbourhood, the name Carpatho–Pannonian area is used in this volume.
1.2. Data base and cartographic representation
On the main map and on the eight supplementary maps (1880–2011), the data shown are mostly census results concerning mother tongue/colloquial language or ethnicity. An exception is the 1879 census of Bosnia and Herzegovina, which provides only denominational data. Until the first half of the 20th century, mother tongue was regarded as the main indicator of ethnic affiliation, and the grouping/clustering of people by ethnicity, nationality or ethnic affiliation emerged in countries in the area only in the 1920s. As these two categories (mother tongue and ethnicity) are significantly different, we sought to display the data of the same category in given years. However, it was not possible in most cases. Before World War II mother tongue was the principal relevant category in most of the countries in the area, and so language data by mother tongue have been shown on the maps. For the period after World War II, data on ethnicity are shown where available. This means that settlements with Roma or Jewish majorities are barely visible on the maps before 1945; these groups become more visible when ethnicity is shown.
The time at which the displayed data were gathered is also a significant factor. Ethnic census data by settlements is not available for all the countries for all the selected years, and so data from the closest census was used (for details, see the reverse sides of the supplementary maps). There were three criteria for selecting the dates displayed on the supplementary maps. First, we looked for census years in which detailed census data were available in the greatest number of countries. Second, we sought to choose years that were of equal time-distance from one another. Third, we also aimed to present the impacts of geopolitical changes on ethnic patterns; therefore, in periods of major change (e.g. the first half of the 20th century) we mapped ethnic structure at smaller time intervals.
The first two supplementary maps (1495, 1784) employ data from an early national tax summary and the census of Joseph II, while the subsequent maps (from 1880) are based on regular census data. The data shown on the main map stem from the 2011 censuses, but in those countries where there was no census in or around 2011 (e.g. Ukraine) or where a traditional census (with questions about ethnicity) is no longer held (Austria, Slovenia) or, further, where the data are only partially available at a regional level (Poland) the most recent data (from censuses in 2001–2002) are shown.
At the time of writing, ethnic data at a settlement level in Bosnia and Herzegovina from the 2013 census were not yet available, and so the data has been limited to the size of settlements. It is important to mention that ethnic data by settlements for Croatia and Slovenia have not been available since 1991; in these cases, the data presented on the main map are the authors’ estimates.
Unlike the maps from 1880 and subsequent years, the two earliest ones (1495, 1784) are not based on censuses but on various estimates and records, whereby the authors have attempted to reconstruct the ethnic pattern only in the area of the Kingdom of Hungary. The authors applied indirect methods (e.g. linguistic analysis of tax-payers’ names, geographic names at the end of the Middle Ages) and studied settlement gazetteers and monographs from the late 18th century in order to identify the majority ethnic group by settlements.
Although these maps are not administrative maps, an exact definition of the referential area of data is necessary if we are to present detailed ethnic patterns in a reliable fashion. Still, it is a difficult task to harmonize the administrative systems of the twelve countries shown in the map extracts. Since our goal was to provide as many details as possible, we chose the settlement as the basic unit of representation (indicated by pie charts).1 However, this differs from the basic administrative unit (commune/municipality) in most of the countries (Austria, Poland, Ukraine, Romania, Moldova, Serbia, Croatia, Bosnia and Herzegovina, Slovenia). As a consequence, and owing to differing historical roots and ethnic structure, we chose a hybrid solution: inside the Carpathian Basin the represented unit is the settlement, while outside of it, in ethnically homogeneous areas where the administrative unit is the commune including 1 to 5 settlements, we worked with municipalities (in Austria, Ukraine). In the case of Romania, where ethnic data by settlements are available and relate primarily to the Romani population, the pie charts refer to settlements even outside the Carpathian Basin.2
The above duality is encountered again in the administrative divisions shown on the supplementary maps. Inside the Carpathian Basin we always used the contemporary administrative divisions. However, the supplementary maps for 1495 and 1784 employ the administrative divisions and basic map as of 1880, in view of the uncertainty of the contemporary boundaries between settlements.
At the same time, outside the Carpathian Basin – owing to the lack of available sources (e.g. statistics, maps) – we worked with a constant settlement network (which is displayed on the main map). The exceptions are those independent settlements that had a different ethnic background from that of other settlements in the administrative division. The above method resulted in the loss of information primarily in those areas where the former inhabitants were subsequently deported and the settlement was attached to a commune with a different ethnic majority (e.g. the German settlements of Bukovina and Bosnia), and also in the case of towns whose ethnic structure differed from that of the surrounding villages which were later attached to the town (e.g. Brno, Cieszyn/Český Těšín). Thus, in such cases, minorities are not visible even on the preceding maps.
The representation method for ethnic data accords with that used in other works in the map series published by the Geographical Research Institute. The scale of the main map means that population size and ethnic distribution can be shown jointly. Pie charts in proportion to the population size show the population of a certain settlement (the radius is proportional to the square root of the population), while different colours express its ethnic structure. The broad spectrum of our data – ranging from an administrative entity with a population of one to a city of 1.8 million – determined the parameters of the pie charts. For visual reasons, ethnic groups with low population shares, which would be illegible on the pie charts, were merged into the ‘other’ category.3 On the supplementary maps, in view of the small scale and the incomplete nature of the contemporary data, population size may not be indicated. What is shown is the absolute or relative ethnic majority, through the application of the surface method. Such maps are easy to read despite the small scale, which, however, conceals local minorities. Since the surface method does not give an impression of the unevenness of population density, it was necessary to extract “uninhabited” areas (those without permanent settlements) from the surfaces. Such uninhabited areas were determined using land cover data and old military topographic maps.
When selecting the geographic names to be included on the main map, we aimed to give not only complementary information that would facilitate orientation but also to offer thematic information. The toponymy of our maps consists of place names, shown first in the official language and then in the minority language(s) where the population share of a minority reaches 10%, or 3% in the case of local minority communities with more than a thousand inhabitants. Evidently, the names of almost 34,000 independent settlements could not all be shown on the main map at this scale. The names of administrative centres and of settlements with more than a thousand inhabitants are always shown. The names of settlements with smaller populations are sometimes shown, depending on the local ethnic structure and on the settlement density in a given area. On the supplementary maps, only the names of settlements playing an important (mostly administrative) role at the given time are shown, and in every case they are displayed in the official or dominant form or spelling at the time.
One of the most difficult tasks was to choose colours representing the various ethnic groups. On the main map sixteen visually distinct colours are used, while on the supplementary maps as many as eighteen colours may be seen, all of which are visually distinct. The colours used on the main and supplementary maps are basically the same, although the tones seen on the supplementary maps are somewhat lighter. When selecting the colours, the criteria applied were distinctiveness, a contrast effect, tones of colours, the location of territories marked by a certain colour, and, accordingly, the cartographic placement of light and dark colours; further, none of the ethnic groups was to be dominant on the maps.4 Additional considerations were the colours used in previous map series published by the Institute as well as other cartographic features (relief, hydrography). It should be noted that assigning colours to ethnic groups on the basis of language families (see e.g. Jordan et al. 2006) was not an objective of the present atlas. The finite number of distinct colours not only represented a technical restriction but also placed limits on the content.
Owing to the ethnic complexity of the Carpatho–Pannonian Area, the number of ethnic groups recorded at the censuses – in significant numbers or in highly concentrated areas – is very high. For this reason, in line with the practice in previous editions, we have presented together some linguistic and religious groups that closely resemble each other and which are otherwise separated merely on account of (geo)political circumstances. In each case we have indicated such composite categories in the legend.
A relatively new phenomenon in the census practice of several countries (Hungary, Poland, and the Czech Republic) is the opportunity to indicate multiple ties. In the aforementioned countries a respondent may state an affiliation with several ethnicities, a practice that constitutes a new challenge for ethnic cartographers. For us, the primary difficulty is that the number of possible responses exceeds the figure for the total population (i.e. the aggregate percentage is greater than 100%), and so the results cannot be shown on pie charts, in view of the absence of detailed and disaggregated data. Where the responses did amount to more than 100% of the population, we solved the problem by subtracting the excess responses from the value for the state-constituting nation, thereby promoting the visual representation of the minorities.
2. Ethnic patterns of the Carpathian Basin
2.1. From the late 15th century until the late 18th century
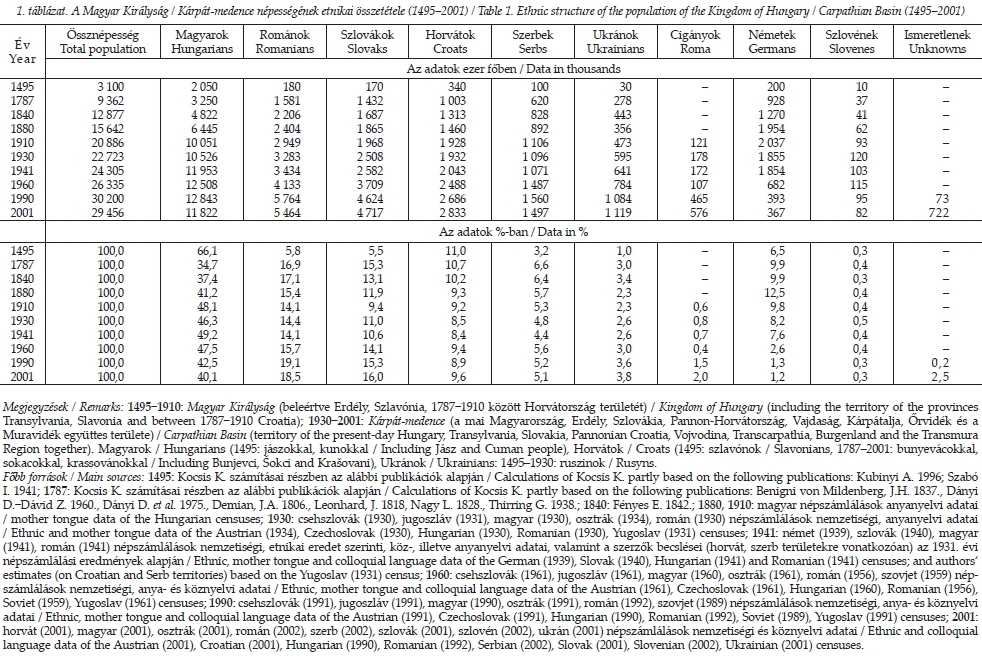
At the end of the Middle Ages (at the time of the rendering of the account of the Hungarian royal treasurer in 1495), the ethno-linguistic structure of the 3.1 million inhabitants of the 307,000 square kilometres of territory that formed the Kingdom of Hungary was as follows: 2–2.1 million Hungarians (approx. 66% of the total population and including 80,000 Szeklers and 23,000 people of Cumanian or Jassic identity) and approx. 1–1.1 million non-Hungarians (including 340 thousand Slavonians-Croats, 200 thousand Germans [Saxons], 180 thousand Romanians [Vlachs], 170 thousand Slovaks, and 100 thousand Serbs).5 The ethnic Hungarian share was as high as 74% in the areas of the country lying north of the Drava and Danube rivers (Table 1). The Hungarian–Slavic language boundary ran 20–30 km to the north of the present boundary on the territory of Slovakia and Transcarpathia (Kniezsa 1941). In Transylvania, both the Szeklerland and the Transylvanian Basin were overwhelmingly inhabited by Hungarians.
Between the Transylvanian Basin and the central lowlands of the Hungarian Kingdom, the latter also being inhabited primarily by Hungarians, there were several ethnically mixed regions, with Hungarians living in the valleys of the Szamos (Someş), Kraszna (Crasna), Sebes-Körös (Crişul Repede) and Maros (Mureş) rivers and Romanians inhabiting the hills and mountains and migrating from south to north in the area of the Apuşeni Mountains.
In the south, the lowlands of the Banat region, the entire Bačka, the northern margin of Syrmia (Srem), as well as the environs of Eszék (Osijek) and Valkóvár (Vukovar) had a predominantly Hungarian population despite the increasing Serbian immigration from the Balkans. These economically flourishing areas in the south had high population densities until the late 15th century, but later on, as a consequence of the Ottoman devastations and the peasant war in 1514, the Hungarian population decreased significantly. During the 16th century, the ethnic character of the southern borderlands changed as a result of the above processes and the steady influx of Serbian refugees from the Balkans.
In the course of the two centuries following the Battle of Mohács (1526), which became the symbol of the collapse of the Medieval Hungarian State, virtually the entire Carpathian Basin became an almost constant battlefield. The ethnic pattern of the late Middle Ages, characterized by Hungarian predominance, was overturned. The Hungarian population diminished from 2–2.1 million to 1.5 million mainly as a result of the anti-Ottoman struggle and domestic strife; on the other hand, the number of non-Hungarians grew from 1–1.1 million to 1.7 million. According to Szabó (1941), the ethnic Hungarian population fluctuated between 1.2 and 1.75 million at the turn of 18th century.
Indeed, the Hungarian population almost entirely disappeared from the southern areas (Banat, Bačka, Syrmia, Slavonia), and the majority of Hungarians either perished or fled from the Transylvanian Basin, the central part of the Alföld (Great Hungarian Plain) and from the southeastern parts of Transdanubia. During the 150 years of Ottoman rule, the Principality of Transylvania preserved the continuity of Hungarian statehood.
However, successive Habsburg, Wallachian (Romanian), Ottoman and Tartar campaigns (1599–1604 and 1657–1661) devastated the areas populated by Hungarians, mainly in the Transylvanian Basin. Thereafter, from the second half of the 17th century, the Hungarians in Transylvania became less numerous than the Romanians, who lived in the more sheltered highlands. At the same time, Hungarian refugees from Central and Southern Hungary significantly strengthened the Hungarian communities in the towns of Upper Hungary (today mostly Slovakia), as a result of which Hungarians became the majority in such places as Kassa (Košice, Kaschau) and Rozsnyó (Rožňava, Rosenau). The disproportionate losses of the Hungarians were the consequence of the fact that most of their settlements were situated on the plains, among hills and in river valleys, which were almost indefensible at time of war. However, sometimes the environment, providing natural protection (e.g. the Danube and Tisza rivers), or certain political factors (e.g. the cities of the Alföld that rated for the domain of the sultan) guaranteed the survival of autochthonous Hungarian communities even in the regions hit by wars.
Almost immediately after the 150 years of Ottoman occupation and the defeat of Rákóczi’s War of Independence (1711), Hungarians (and to a lesser extent other ethnic groups) began to migrate en masse towards the desolated but agriculturally rich areas of the Alföld. From the northern and eastern highlands that provided protection at the time of wars, thousands of Slovaks, Rusyns and Romanians migrated to places that the Hungarians had left, and also diffusely to the inner parts of Hungarian ethnic areas (Szabó 1941). In the 18th century, the population in certain parts of the Carpathian Basin (e.g. in Bačka, Banat, Eastern Slavonia, Southeastern Transdanubia) was extraordinarily diverse in ethnic terms. This was a consequence not only of voluntary migration, which had been fuelled by an uneven distribution of population and the economic opportunities in the south, but also of organised colonization programmes. The colonization policy of the Habsburg Empire, which reflected economic, religious and ethnic factors, supported the settling of Catholic and German populations, whilst it hindered the return of Hungarians and Protestants – especially in Bačka and Banat – for decades.
As a result of the migration movements of the 18th century, between 1720 and 1787 the total population of the Carpathian Basin, according to the authors’ estimates, grew from 4.3 million to 9.4 million. Specifically, the number of Hungarians increased from 1.7 to 3.2 million, while non-Hungarians from 2.6 to 6.1 million – mainly due to the immigration of 3 million Germans, Serbs, Romanians, Rusyns etc. (Wellmann 1989; Szabó 1941). Thus, the ethnic proportions fundamentally changed. By the end of the 18th century, when nationalism began to emerge from the process of Enlightenment, the share of the titular ethnic group, the Hungarians, fell to an all-time low (34.7%).
Between 1495 and 1784, the number of settlements with a Hungarian majority dropped from 6,785 to 4,418, which represented 30.6% of the more than 14 thousand settlements in the Carpathian Basin in 1784. As the result of these processes, the Hungarian settlement area shrank and split into two ethnic blocks – one larger and one smaller (Szeklerland) – separated by territories inhabited by non-Hungarians. The Ottoman occupation, domestic strife and the ensuing waves of migration fundamentally altered the ethnic geography and structure of the Kingdom of Hungary.
2.2. From the late 18th century until 1918
The devastation of the 16th and 17th centuries and the subsequent migration of millions of inhabitants in the 18th century reshaped the medieval ethnic structure of the area under investigation and the outlines of the modern ethnic pattern took shape. In rural areas, the slowly stabilizing ethnic and language boundaries did not change significantly after the end of the 18th century. As the wave of migration drew to a close, the number and ratio of Hungarians living in areas of greatest agricultural potential grew three times faster than those of the other ethnic groups. The population number (and ratio) of Hungarians increased from the estimated 3.1 million in 1790 (31.5%: Wellmann 1989; Szabó 1941) to 4.8 million (37.4%) by the 1840s according to Fényes (1842).
According to the Austrian census of 1850, the Hungarian population barely changed compared to its level around 1840 (4.8 million, 41.6%), despite war losses during the War of Independence in 1848–49. By the time of the 1869 census, which took place shortly after the Austro–Hungarian Compromise (1867), the number of Hungarians in the Kingdom of Hungary (without Croatia and Slavonia) had grown to 6.2 million and by 1880 to 6.4 million. In 1910 it was about 10 million (Kovács 1920). These ethnic changes, which favoured the Hungarians, were mainly due to the higher natural increase of Hungarians, their lower rate of emigration relative to that of other ethnic groups, and the internal migrations of non-Hungarians moving from peripheral and highland regions to the central parts of Hungary inhabited primarily by Hungarians, which resulted in assimilation. The process of assimilation was also facilitated by the favoured political situation of the Hungarian nation and language after 1867. Furthermore, it should be mentioned that around the turn of the century, at a time of intense industrialization and an economic boom, the poor Hungarian rural masses, whose ratio within the country’s agricultural population far exceeded that of the minorities (Kovács 1920), settled down in non-Hungarian or ethnically mixed towns to a greater extent than did other ethnic groups, thereby contributing to the extensive assimilation of minorities and to the Hungarian language becoming the mother tongue of the majority of the local population in urban and industrial neighbourhoods.
As a result of the accelerated assimilation of minorities, 77.5% of the urban inhabitants of the country declared a Hungarian identity and 88.9% could speak Hungarian in 1910. The capital, Budapest, well illustrates this ethnic process, with the proportion of people declaring themselves Hungarian increasing from 36.8% in 1850, to 56.8% by 1880, and to 85.9% by 1910. The language and identity change primarily affected the upper classes of society. In 1910, 82.3% of the 300 thousand intellectuals of the country declared Hungarian, 8.6% German, 4.3% Romanian, 1.5% Slovak as their mother tongue (Kovács 1925). Following the immigration and subsequent assimilation of a Jewish population, the Hungarian share was even greater among economic intellectuals (84.5%). The number of Israelites was 83 thousand around 1787, increasing to 542 thousand by 1869 and to 920 thousand by 1910 (Szabó 1941). Obviously, the assimilation process favourable to Hungarians had different effects on the various minority ethnic groups. More than one third of the approximately two million inhabitants who became Hungarian native speakers between 1850 and World War I were Jewish, one quarter of them German and one fifth Slovak (Katus 1988). Assimilation of some of the minorities in the final decades of the Austro−Hungarian Monarchy was widely resented by their intellectuals, and it served as an important argument in the anti-Hungarian propaganda campaign of Czechs (Slovaks), Romanians and Serbs after World War I, in the radically changed political situation.
The growth of the Hungarian ethnic territory in rural regions was only noticeable in the ethnically mixed areas, contact zones inhabited by a population of uncertain and/or multiple ethnic identity, and in the – mainly Slovak, Rusyn and German – language islands surrounded by Hungarian settlements. As a result of the rapid assimilation of the minority urban population, most of towns in the Hungarian ethnic area and along the Hungarian language borders appeared almost homogeneous, or at least 80–90% Hungarian. At the same time, several towns that lay outside the traditional Hungarian ethnic territories had become Hungarian language islands by 1910 (e.g. Zólyom/Zvolen, Eperjes/Prešov, Munkács/Mukachevo, Szamosújvár/Gherla, Vajdahunyad/Hunedoara).
2.3. From 1918 until the early 21st century
According to the data of the National Office for Refugee Affairs (Budapest), 350 thousand (in reality 426 thousand) Hungarians fled to the territory of the post-Trianon Hungarian state in the period 1918–1924, after World War I (Zeidler 2002). The regional distribution of the officially registered Hungarian refugees was the following: 197 thousand from the territories annexed by Romania, 107 thousand from the new Czechoslovak areas, and 45 thousand from the southern regions ceded to the new Kingdom of Serbs, Croats and Slovenes (Petrichevich-Horváth 1924). A striking phenomenon in the interwar period was the placing of Jewish and Romani people who had previously declared Hungarian to be their mother tongue in separate categories in the ethnic statistics in Czechoslovakia and in Romania. Consequently, especially in Slovakia, Transcarpathia and Transylvania, the number of those recorded as Hungarians was much lower than the figure implied by the Hungarian mother tongue data of the census of 1910. In the successor states, the majority of the people with uncertain or multiple ethnic identities, who were able to speak at least two languages, were listed as non-Hungarians in the official census statistics, and this factor also contributed to the rapid decrease in the number of Hungarians. Such multilingual and hybrid populations lived generally in towns along the language border, and especially in the areas between Nitra (Nyitra), Nové Zámky (Érsekújvár) and Levice (Léva), in the region of Košice (Kassa) and Trebišov (Tőketerebes) (all in Slovakia), in the western section of Sevluš (Vinohradiv, Nagyszőlős) in Transcarpathia, and in certain parts of Satu Mare (Szatmár) and Sălaj (Szilágy) counties in Romania.
The rapid statistical decline in the number of Hungarians in the Carpathian Basin between 1920 and the mid-1930s was temporarily halted by territorial revisions between 1938 and 1941 (e.g. the First and Second Vienna Awards). In this process, the majority of territories inhabited by minority Hungarians (present-day South Slovakia, Transcarpathia, North Transylvania with Szeklerland, Bačka, present-day Croatian Baranya, and the Slovenian Transmura Region) were returned to Hungary. In these regions, especially in Transcarpathia, in Slovakia and in Transylvania, the number of people declaring themselves Hungarian increased with the return of Hungarian public servants (clerks, policemen, soldiers etc.) and owing to the settling of Hungarians from Bukovina. An additional factor was that the bilingual population and a majority of Jewish people declared a Hungarian ethno-linguistic affiliation once again. The territorial revisions that had been favourable to the ethnic Hungarian populations were reversed after World War II. In this way, 125 thousand Hungarians from Romania, 120 thousand from Czechoslovakia, 45 thousand from Yugoslavia, and 25 thousand from the Soviet Union (Transcarpathia) fled to the territory of present-day Hungary. Meanwhile, the Czechoslovak government deported 44 thousand Hungarians to compulsory labour in the Czech–Moravian lands with a view to accelerating the Czechoslovak–Hungarian “population exchange” between 1945 and 1948. The number of Hungarians in the neighbouring countries fell not only as a result of emigration, war losses, the murder of a majority of Hungarian Jews (Braham 2007), but also in consequence of the changing self-identification of the population with uncertain or multiple ethnic ties, the “Reslovakization” process in South Slovakia, and the fervently anti-Hungarian political atmosphere. As a result of these circumstances, the number of Hungarians dropped principally in Slovakia, Transcarpathia and in Transylvania. In the aftermath of World War II, the number of Hungarians decreased to a far smaller degree in some border areas belonging once again to Yugoslavia (e.g. Bačka, Banat). This was so despite the vendetta of Serbs, which had thousands of Hungarian victims in late 1944.
In general, it can be stated that under communism the number of Hungarians increased steadily in Hungary (to 10.6 million) and in areas of the Carpathian Basin outside Hungary (to 2.8 million) until the early 1980s. Thereafter the figures rapidly decreased (to 10.2 and 2.7 million) as the natural increase rate turned negative and the Hungarian minorities began to migrate to Hungary. The extent of the Hungarian settlement area did not change significantly between 1949 and 1990. Changes in the ethnic spatial pattern were only detectable in urban neighbourhoods and rural ethnic enclaves (in favour of the titular nation in all countries) due to the accelerating internal migration and assimilation processes.
In this period, the number of Hungarians increased or stagnated in Vojvodina, in Croatia and in the Slovenian Transmura Region until the 1960s. In the subsequent period, the number of Hungarians in Yugoslavia fell significantly as many of them took up employment in Western Europe. Natural decrease and the introduction of the so-called “Yugoslav” ethnic category, which was popular among the minorities and persons of mixed ethnic background, were additional factors. Natural increase among Transylvanian Hungarians was offset by the nation-building initiatives of the ethnocratic Romanian nation-state. In Slovakia, with the decline of the general discrimination experienced by Hungarians between 1945 and 1948, the number of people self-identifying as Hungarians increased in the 1950s. However, this increase, which had been enhanced by a rising birth rate, suddenly fell away from the 1970s onwards.
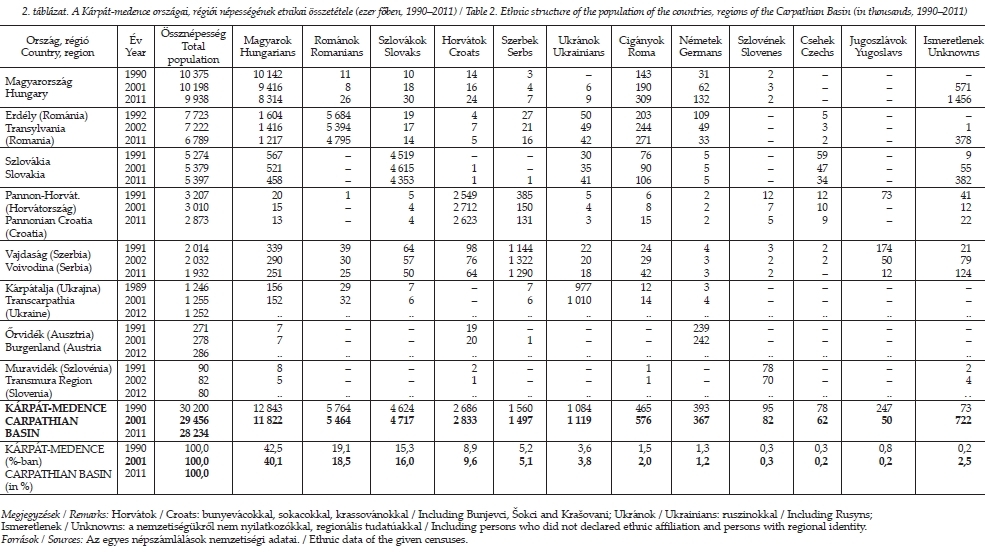
As a result of the negative demographic processes, the ratio of Hungarians in the total population of the Carpathian Basin dropped from 42.5% to 39.7% between 1991 and 2001. The reduction in the number of Hungarians was naturally higher among people of minority status (-10.9%) than in Hungary (-7.2%).
In the decade after 1989, the countries in the area generally experienced a continuation of earlier trends. That is to say, the major traditional minorities (principally the Hungarian communities) declined in numerical terms. At the time of the censuses in 2001–2002, there were 11.7 million ethnic Hungarians and 12 million native Hungarian speakers in the Carpathian Basin. Current estimates indicate around 10.4 million ethnic Hungarians and 10.6 million native Hungarian speakers.6 Meanwhile, the total population of the Carpathian Basin fell from 30.2 million around 1990 to 29.5 million at the turn of the millennium and then to 28.2 million in 2011. All of this means that the Hungarian share of the total population in the Carpathian Basin fell from 42.5% to 40.1% between 1991 and 2001 and then to 36.9% in 2011. This decrease was offset primarily by increases in the percentage of non-respondents to the ethnic questions (0.2%→2.5%→8.3%) and in the percentage of persons who self-identified as Romani (1.5%→2.0%→2.6%) Tables 1 and 2).
Compared with the 1990s, the decrease in the Hungarian share of the population accelerated between 2001 and 2011, owing in part to the increasingly unfavourable demographic indicators (a declining trend, negative rates of natural increase, higher emigration levels from Hungary and from the neighbouring countries mainly to areas outside the Carpathian Basin) and in part to assimilation and a large increase in the number of non-responses to ethnic questions. In the 2000s the decline in the number of ethnic Hungarians was – as in earlier decades – greater among the ethnic Hungarian minority communities (-13.1%) than among those living in Hungary (-11.7%). These values are 3–5 percentage points greater than the average for the 1990s.
The decline in the ethnic Hungarian population varied from area to area: as far as the minority Hungarian communities are concerned, it can be generally stated that the higher the local share of Hungarians, the smaller the decrease. In the period from 2001 to 2011 – similarly to earlier decades – the number of diasporic Hungarians in Slovakia, Transylvania and Vojvodina fell by almost a quarter within a single decade, whereas the number of Hungarians living in compact communities fell – in these same regions – by only 8%. Surveying the larger regions, we find that the decrease in the ethnic Hungarian population was greater in Croatia (annual average of -1.6%), in Transylvania (-1.5%) and in Vojvodina (-1.4%) than it was in Slovakia (-1.2%) or – according to estimates made before the current Ukrainian crisis – than it was in Transcarpathia.
The aforementioned changes in the figures were greatly influenced by both objective (natural and mechanical migration of the population) and subjective factors (other factors influencing ethnic identification, e.g. assimilation). As far as the ethnic Hungarian population is concerned, regional differences in the natural migration of the population have roots going back almost a century. By the turn of the millennium, natural increase among Hungarians had turned negative in all regions of the Carpathian Basin (cf. Gyurgyík 2014; Veres 2015). Over the past decade, natural decrease impacted to the greatest extent on the ethnic Hungarians of Vojvodina, where it became the most significant cause of their population decline. As regards the migration of people, the migration of Hungarians from Hungary to the west is a factor of increasing significance, in addition to the emigration of ethnic Hungarians from Transcarpathia, Transylvania and Vojvodina, the impact of which had been substantial in earlier periods too. Whereas in earlier periods Hungary had been an important destination for people leaving the neighbouring countries, at present most of the emigration – including for temporary employment abroad – from all regions of the Carpathian Basin is directed at areas outside the Carpathian Basin (see Fassmann et al. 2014). The most spectacular aspect of internal migration over the past decade has been the emergence of suburbanisation in the neighbouring countries too. As part of this process, all the major urban agglomerations have begun to grow, resulting in shifts in the ethnic composition of the environs. A new phenomenon is the formation of cross-border suburban areas along the Hungarian national border (e.g. in the Bratislava and Oradea areas).
Many subjective factors can also influence how people self-identify as members of a particular ethnic minority. Such factors include an asymmetrical relationship between majority and minority, the minority policy of the given state, the geographical nature of the settlement area of various ethnic groups (e.g. compact region, enclave or diaspora), and interethnic relations (above all, mixed marriages, which accelerate the assimilation of minorities). All these factors impact on ethnic processes and on self-identification as manifested in the statistics. Such processes – often summarily referred to as assimilation – have resulted in particularly significant decreases in the ethnic Hungarian populations of Slavonia, the Međimurje region, Burgenland and Slovakia (particularly in the major urban centres and along the linguistic boundary). The perceived prestige of the Hungarian community in a given country and societal attitudes exert a significant effect on self-identification among Hungarian-speaking Romani and on their ‘ethnic choice’ at the censuses. Indeed, based on the last three censuses, we know that there have been significant fluctuations in the self-identification of Romani people both in Hungary and in the neighbouring countries. At the censuses, a relatively small proportion (30–40%) of the population regarded as Romani by non-Romani people have declared some kind of affiliation or identity with the Romani community (cf. Kocsis 2003. 713), and there have been wide fluctuations over space and time. Unlike in the case of the traditional national minorities, the fluctuations have been caused primarily by the diversity of Romani identity construction and by changes in societal attitudes (e.g. the extent of Romani stigmatisation) over time.
2.4. Ethnic structure in the early 21st century
2.4.1. Hungary
The Hungarian state has existed in Central Europe since 895. After World War I, 72% of its historical territory, which covered approximately 300 thousand square kilometres, was ceded to the neighbouring states. The lingual spatial pattern of the country is rather homogenous (Hungarian). Even so, the population of the northeastern and southwestern areas are mixed in terms of their ethnic affiliation and origin, owing to the increasing number and ratio of the Romani (who are mostly Hungarian native speakers). At the 2001 census, 5% to 6%, while at the 2011 census, 14% to 15% of the resident population of the country chose not to respond to the questions about their ethnic–linguistic identity. Most of the non-respondents lived in Budapest and its surroundings and in cities outside Budapest. Despite the increasing immigration of ethnic Hungarians from the neighbouring countries, the census number of Hungarians (84%) declined by 2.3 million between 1980 and 2011, owing mainly to natural decrease (which has been a factor since 1981) and to the growing number of people of unknown ethnic affiliation. In view of the opportunity to declare plural ethnic–linguistic affiliations, the number of non-Hungarian native speakers increased moderately or it stagnated, while the number of non-Hungarian ethnic groups increased considerably (especially the Germans, Romanians and the Romani) between 1990 and 2011. The increase in the number and share of people with minority ethnic ties in the post-communist period (1990: 2.6%; 2001: 5.2%; 2011: 7.7%) affected all the ethnic and national minorities in Hungary. Behind this increase, however, several processes were underway, which often differed among the various ethnic groups. The most important of these were: the aforementioned changes in methodology, as a result of which dual affiliations and hybrid identities could be expressed; immigration (e.g. in the case of the Romanians, Serbs, Ukrainians and the non-traditional minorities); the presence of symbolic ethnic affiliations; and natural increase (in the case of the Romani population). All these factors offset the natural decrease that affected most of the minorities as well as the lasting effects of assimilation (for more details see Tátrai 2015). Even so, Hungarians still dominate the country’s ethnic structure, and concentrated minority populations are to be found principally in peripheral areas along the national borders. Reflecting the increase in the Romani population, the northeastern and southwestern regions have increasingly mixed populations.
The 8.3 million ethnic Hungarians constitute the largest ethnic group throughout Hungary with the exception of 20 settlements. At the same time, the non-Hungarian population share – in consequence of multiple ethnic affiliations – exceeds 50% in 62 settlements in the country.7 Between 2001 and 2011, the Romani population, constituting Hungary’s largest ethnic minority, increased by more than 60% to reach 309,000. As in all countries in the region, there is a significant difference in Hungary between the number of people self-identifying as Romani and the number of people regarded as Romani by the rest of society (based principally on certain anthropological features, skin colour, lifestyle, and social behaviour). Variations in the latter figure depend on social conditions in the given period as well as the extent of discrimination, stigmatisation and racist public discourse (see Szuhay 2007. 98–99; Durst 2010. 180; Csepeli–Simon 2004. 135).
Based on various sociological surveys the estimated number of the Romani population was 325 thousand in 1978, 468 thousand in 1993, 570 thousand in 2003 and 876 thousand in 2010–2013 (Hablicsek 2008; Kemény et al. 2004; Kertesi–Kézdi 1998; Pénzes et al. 2015), which is approximately three times more than their census number (Kemény–Janky 2003). Romani people are overrepresented in the less urbanized, underdeveloped, traditional rural territories. According to the 2011 census, 29 villages had an absolute Romani majority. Most of them were located in Borsod-Abaúj-Zemplén County and Baranya County. Two thirds of the Romani live in highly segregated neighbourhoods, some of which constitute ethnic ghettos. This process is characteristic of both towns and entire regions, leading to the gradual separation of the Romani and non-Romani populations (Virág 2006). Regions with the highest Romani population share (10−23.2%) are the following: Nógrád, Borsod-Abaúj-Zemplén, Szabolcs-Szatmár-Bereg counties and the Middle Tisza region in Northeast Hungary; Baranya and Somogy counties in South Transdanubia. The largest communities of Romani live in Budapest, Miskolc and Ózd. Although the number of people self-identifying as ethnic Germans in Hungary has grown rapidly from 31,000 to 132,000 over the last three censuses (owing principally to such phenomena as dual affiliation and symbolic ethnicity [cf. Tátrai 2015]), the numbers are still far smaller than they were in the period before the resettlement (deportation) actions of 1946–1948. Today, compact German populations are to be found only in the Transdanubian Mountains, in the rolling hills of Baranya and Tolna counties, and in a few diasporic settlements in several other regions. Despite the size of their community, ethnic Germans form a majority of the population in just 13 settlements. The largest German communities can be found in Budapest, Pécs, Pilisvörösvár and Bonyhád. Due to the process of assimilation and the Czechoslovak–Hungarian population exchange between 1946 and 1948, the settlement area of Slovaks – which emerged in the 18th century and consisted of three bigger areas (in Békés, Pest, Nógrád counties) and four smaller areas (in the Zemplén, Bükk, Mátra, Bakony Mountains) – has now been reduced to small ethnic enclaves. Slovaks form the majority of the local population in just one village (Csővár). Even so, owing to the reasons already mentioned in relation to the ethnic Germans and to cross-border suburbanisation in the Bratislava and Košice areas, the number of ethnic Slovaks in Hungary has increased by around 70% since 2001.
The two-sided nature of the process, however, is well illustrated by the fact that there have been no real increases in the traditional ethnic Slovak settlement area. Indeed, the number of Slovak native speakers fell in the period to 2011, owing to assimilation, which remains a significant factor. Croats can be subdivided into various ethnographic groups: Šokci (Southeastern Baranya), Bosnians (South Baranya), Bunjevci (Bácska), Croats of the Dráva and Mura regions and Croats living along the Austrian border. While they constitute an ethnic majority in 12 villages in the border areas, their largest community is in Budapest, outside their traditional settlement area.
The number of ethnic Romanians increased threefold in the past decade to reach 26,000, mostly owing to large-scale immigration. This process significantly restructured the ethnic Romanian community, with 75% of its members having been born outside Hungary and so not counted as autochthonous. External and – since the 1990s – internal migration of an economic nature has fundamentally altered the ethnic spatial structure of the Romanian community. Today, one in three ethnic Romanians lives in counties along the Hungarian−Romanian border, while a half of the community lives in the central part of the country. The large increase in the overall number of Romanians was mostly realised in this latter area, while the number of ethnic Romanians in their traditional settlements has fallen, despite the effect of cross-border suburbanisation in the Oradea and Arad areas (see Tátrai 2015). Accordingly, Budapest is now home to by far the greatest number of Romanians, while their number exceeds that of the Hungarians only in Méhkerék.
The number of Serbs doubled between 2001 and 2011 due to immigration from Serbia. Most of them live in the southern border zone and near the Danube, where they form the majority of the local population in just one village (Lórév). Out of the 13 recognized minorities, only the Slovenes registered a fall in numbers after the turn of the millennium, which reflected their ongoing assimilation. They inhabit a small hilly area between the Austrian and Slovenian borders and near the River Rába, where their most populous communities are to be found in Szentgotthárd and Felsőszölnök. In consequence of a strengthening of Rusyn ethnic identity, the census of 2011 recorded (for the first time since the 19th century) a settlement in Hungary with a Rusyn majority. Over a ten-year period, Hungary’s ethnic Rusyn population grew threefold to 3,300. Their area of settlement is limited primarily to northeastern Hungary, albeit the largest Rusyn community is to be found in Budapest.
2.4.2. Slovakia
The Slovak Republic existed for the first time between 1939 and 1945 and has been an independent country since 1993. Over the centuries its territory belonged mostly to the Avar Khaganate (680–791), to the Slavic states of Nitra, later Moravia (825–900), to Hungary (900–1918) and to Czechoslovakia (1918/1920–1939; 1945–1992). Its ethnic spatial structure is basically dualistic, with Slovaks prevailing north of the Slovak–Hungarian contact zone and Hungarians living mostly in South Slovakia. The ethnic unity of the Rusyn settlement area, which existed in the northeastern border regions from the Middle Ages, is no longer intact. Currently, Romani make up a quarter of the population in East Slovakia, and some microregions have Romani majority populations. In Slovakia, the Hungarian community has continued to exhibit unfavourable demographic trends in the 2000s. Such trends are caused by the community’s low natural increase, which is less than that of the majority Slovak population, and its assimilation rate – the highest among the four major Hungarian communities outside Hungary (cf.
Gyurgyík 2014). Meanwhile, the number of ethnic Slovaks has also fallen, even though their natural increase has been positive since the second half of the 2000s; the main cause of this is a rapid increase in the population share of unknown ethnicity.
In the last ten years, unlike the ethnic Hungarians and Slovaks, both the Romani and the Rusyn/Ukrainian populations have increased. The increase in the Romani population is due to their positive natural increase and to shifts in their ethnic identification, as also observed in Hungary. The increase in the Rusyn/Ukrainian population is linked, as the statistics show, both with a halt in their assimilation and with a regional shift in their ethnic (and mother tongue) identification as Rusyns or Ukrainians towards the Rusyn ethnicity, which had been dominant in the first half of the 20th century. At the same time, when evaluating the increase in the Rusyn population, one should not ignore the presence of symbolic ethnic identification, which resembles the process observed in Hungary.
As a result of the administrative reforms of 1996, which also served ethnic political aims, the titular nation, the
Slovaks, numbered 4.3 million and formed an absolute majority of the population in all regions (kraj) and in all districts (okres) – except for those of Dunajská Streda, Komárno and Medzilaborce. Mainly as a consequence of the assimilation process, which was induced by Slovakia’s strikingly asymmetric majority-minority relations, 34 settlements (mostly in the ethnic contact zone) moved from Hungarian to Slovak majorities in the last decade, while there were no changes in the reverse direction.
The number of ethnic
Hungarians fell to 458 thousand by 2011 (with 509 thousand by native language). The former almost homogeneous Hungarian character of present-day South Slovakia (more or less the same territory that was returned to Hungary between 1938 and 1945) has been transformed, owing to Czechoslovak colonizations, deportations and the forced assimilation of Hungarians (“Reslovakization”) between 1945 and 1948. The ethnic composition of towns along the Slovak–Hungarian language border (e.g. Nové Zámky, Levice, Lučenec, Rimavská Sobota, Košice) also underwent significant changes in the same period. Currently, only slightly more than one-fifth of Hungarians live in a settlement where their share of the population is over 80%. The number of settlements with a Hungarian majority has fallen to 380 (from 416 in 2001). The largest Hungarian communities live in Komárno, Dunajská Streda, Bratislava, Nové Zámky and Kolárovo.
The census statistical figure for the
Romani population (106 thousand) lags far behind the number of Romani estimated in surveys (403 thousand and 7.5% in 2013; Mušinka et al. 2014). The great majority of the Romani people have been living in the eastern and southeastern areas (east of the Poprad–Lučenec line) for centuries, where, according to the census data, 22 (other estimates suggest 90) villages have a Romani majority. Their largest communities can be found in Košice, Trebišov, Jarovnice, Rakúsy and Lomnička.
Although the figure has increased significantly in the last two decades, only 41 thousand persons declared themselves to be ethnic
Rusyns and
Ukrainians, and yet the community numbered almost one hundred thousand in the early 20th century. The great majority of them inhabit the northeastern regions neighbouring Poland, where their most populous communities are in Medzilaborce, Humenné, Prešov and Svidník. The number of settlements with a Rusyn and Ukrainian ethnic majority is 48 (or 129 according to the native language criterion).
The population of
Czechs and
Moravians in Slovakia, most of whom moved to the country after 1945 and who once numbered almost 60,000, decreased to 34,000 by 2011. They live principally in urban areas and in scattered locations along the western border. Among the one-time major ethnic groups, one should also mention the
Germans (5,000 persons), whose numbers greatly decreased in consequence of the resettlement (deportation) actions after World War II and the subsequent assimilation. The remnants of their settlement area can still be found in the Kremnica region and in the former mining colonies of the eastern part of the Slovak Ore Mountains.
The number of non-respondents in Slovakia has sharply increased over the past ten years to 382,000. Similarly to Hungary, their geographic distribution is even, albeit the willingness to respond is generally higher in Western Slovakia than in Central or Eastern Slovakia. Non-respondents are significantly overrepresented among the younger age groups and in municipalities with more than 10,000 inhabitants (cf.
Gyurgyík 2014).
2.4.3. Transcarpathia (Ukraine)
Transcarpathia (
Zakarpattia in Ukrainian) is the westernmost administrative oblast (province) of Ukraine, which in the past has been a part of Hungary (896–1919, 1939–1944), of Czechoslovakia (1920–1939) and of the Soviet Union (1945–1991). At Ukraine’s most recent census in 2001, more than 81% of the almost 1.3 million inhabitants of Transcarpathia self-identified as
Ukrainians and 12.6% as Hungarians. Natural processes since 2001 and the consequences of the armed conflict in eastern Ukraine since 2014 have, in all likelihood, altered significantly the above population numbers and shares, which at present cannot even be estimated.
8 Accordingly, the following is limited to a presentation of the state of affairs in 2001. At that time, 81% of the total population (1.3 million persons) of the region claimed to have Ukrainian and 12.6% Hungarian ethnicity. The Ukrainians formed a majority of the population in all raions (districts) and towns (apart from Berehovo and its district). Their most populous communities lived in Uzhhorod, Mukachevo, Khust, Vynohradiv and Svaliava. In the course of the 20th century, the number of people – within the region’s population – self-identifying as Rusyns fell drastically, owing to a six-decade ban on, and subsequent non-recognition of, this ethnic category. Thus, in 2001, no more than 6,800 claimed to be native Rusyn speakers.
9
The other populous ethnic group of the area is that of the
Hungarians, who became a minority on the present territory of Transcarpathia in the late 17th century, at which point the Rusyns became more numerous (1495: 64.6%, 1715: 41.1% Hungarians). Hungarians form a majority of the population in 83 settlements, mostly along the Ukrainian–Hungarian border, where the only town with a Hungarian majority (Berehovo) is to be found. The most populous Hungarian communities are in Berehovo, Uzhhorod, Mukachevo and Velyka Dobron’.
Russians (36 thousand persons) became a significant minority group as a result of immigration and resettlement after 1945. In that period, government and party officials, as well as soldiers and their families, moved to Transcarpathia, overwhelmingly to towns (Uzhhorod, Mukachevo, Berehovo, Khust).
Romanians (33 thousand persons) are concentrated spatially along the boundary of the Rakhiv and Tiachiv districts.
An overwhelming majority of the
Romani population (14 thousand persons by ethnicity and 3 thousand by native language) declared Hungarian to be their mother tongue in Transcarpathia. They live mostly in the lowlands, in a traditionally Hungarian area and in towns within the Hungarian–Ukrainian contact zone. Like in other regions of East Central Europe, the estimated number of the Romani in Transcarpathia is much higher (ca. 32 thousand in 2001) than the census figure. Half of them live in the Vinohradov, Uzhhorod and Berehovo raions and in Mukachevo (Braun et al. 2010. 42–43). The small
Slovak minority lives in Uzhhorod and in its surroundings. The number of
German speakers is fewer than 2,000 as a result of substantial emigration and assimilation. Most of them live in Mukachevo and in its environs.
2.4.4. Transylvania (Romania)
A part of the Carpathian Basin, covering more than 100 thousand square kilometres and belonging to Hungary between 895 and 1918 and to Romania today, is called in a broader sense “Transylvania” (
Ardeal or Transilvania in Romanian). It encompasses not only Transylvania proper, but also the historical regions of Partium (Crişana, Maramureş) and the Romanian part of the Banat region. Between 1541 and 1690 Transylvania was an independent Hungarian principality, a vassal state of the Ottoman Empire; between 1690 and 1703 and in 1711–1867 it existed as a province (belonging to the Hungarian Crown) of the Habsburg Empire. It formed part of Hungary again under the Austro−Hungarian Monarchy (1867–1918). It has belonged to Romania since 1918 (1920), but in the period 1940–1944 its northern part was temporarily returned to Hungary under the terms of the Second Vienna Award (1940).
Due to increased emigration, Transylvania, like other regions of Romania, suffered a great population loss between 1991 and 2011, as a result of which its population fell from 7.7 million to 6.8 million. The fall in population would have been even greater, if the Romanian Institute of Statistics had not revised the data after the census, supplementing the census data with register-based data. Moreover, there is no information on the ethnic ties of this population, and so in Romania the category ‘unknown ethnicity’ includes persons who did not respond to the question and those who were included in the census only after it had taken place and without being personally contacted (
Kapitány 2013;
Veres 2015). Thus, in Transylvania the number of people whose ethnic ties are unknown increased from around a thousand a decade ago to 380,000 in 2011.
Still, alongside the significant nominal population decline, the relative ethnic population shares have barely changed over the past two decades – at least if we examine those who made a statement on their ethnic ties. The large-scale emigration of the Romanian population offset, to a certain extent, the assimilation of the minorities, while the effect of relatively low rates of mobility and emigration among the minority population – less than the corresponding rates among the Romanian population – was annulled by a rate of natural increase that was more unfavourable than that of the majority nation. The Romani, a minority with a high natural increase rate, were the only ethnic group to increase in number. In the ethnic spatial structure of Transylvania, two Romanian ethnic blocks (South Transylvania−Bihor and North Transylvania−Maramureş), two Hungarian ones (Szeklerland and North Bihor), and between them ethnically mixed zones can still be observed. As a result of Romanian nation-building and the ethnic homogenization policy, the ratio of Romanians in Transylvania increased from 55.1% to 74.7% in the course of the 20th century (
Varga 1998) and then fell to 70.6% by 2011, while the share of Hungarians dropped from 32 to 18%.
The population share of
Romanians, the titular nation, exceeds 80% in seven of Transylvania’s sixteen counties, and the Romanian share is 50−80% in seven further counties. Areas inhabited predominantly by Romanians can be found in the Southern Carpathians, in the Apuşeni Mountains and in the common border areas of the counties Maramureş and Bistriţa-Nasăud. Approximately 60% of Romanians live in towns and communes in which their population share is over 80% (2002: 73%). Six cities (Timişoara, Cluj-Napoca, Braşov, Oradea, Sibiu, Arad) have more than 100 thousand Romanian inhabitants. One half of the
Hungarian population lives in Szeklerland, and in two counties (Harghita 83%, Covasna 72%) Hungarians still form the ethnic majority. A quarter of the Hungarian population lives in the Partium region (Bihor, Satu Mare, Sălaj, Maramureş counties). According to the census of 2011, only one third of them live in towns or communes that are predominantly (over 80%) inhabited by Hungarians. Meanwhile, a quarter of the Hungarians live in communes where their population share is below 20%. In such communes, their language does not have official status. The largest Hungarian communities live in the towns of Szeklerland (Târgu Mureş, Sfântu Gheorghe, Odorheiu Secuiesc, Miercurea Ciuc), and in Cluj-Napoca, Oradea and Satu Mare.
At the 2011 census, 271 thousand persons declared
Romani ethnicity in Transylvania and 622 thousand in Romania as a whole. As in other countries in the region, there is a large gap between the official and estimated numbers of the Romani. Estimates made by scholars (1.8–2 million persons) and Romani NGOs (2–2.5 million persons) are three to four times the census figure (
Preda−Zamfir 2002;
Creţan–Turnock 2009;
Kiss 2012).
The Romani population share is somewhat higher in Transylvania than in the other historical regions of Romania. In Transylvania, the greatest number and share of Romani people is to be found in the Transylvanian Basin (mainly the former Saxon lands and the Mureş valley) and in lowland areas near the Hungarian–Romanian border (Satu Mare, Bihor, Arad, Timiş counties). More than two-thirds of Transylvanian Romani still live in villages; however, their most populous communities are in cities such as Cluj-Napoca, Baia Mare, Târgu Mureş, Turda and Arad. Half of the 71 settlements with a Romani majority are situated in Mureş and Bihor counties. The native language of the majority of the Romani population is usually the locally dominant language (Romanian or Hungarian).
The ethnic
German population, the third most populous minority in Transylvania until the 1980s, has halved from census to census (1992: 109,000; 2002: 53,000; 2011: 33,000, 0.5%). Their exodus from Romania, which began under communism, did not cease even after democratisation. Today, therefore, mostly the older members of the community remain in Transylvania; thus, the ethnic German population in Romania is an aged one (see Veres 2015, 47–48). One-third of them (the Saxons) inhabit historical Transylvania, while two-thirds live in the Banat and Partium regions (Swabians). In consequence of their exodus over the past three decades, there are hardly any communes where the German population share reaches 5%. In rural areas, some scattered German ethnic enclaves can still be found in Satu Mare county (around Carei), while the largest German communities are in such cities as Timişoara, Sibiu and Arad.
The majority of the
Rusyns and
Ukrainians (42 thousand persons) still inhabit the southern part of Maramureş, near the Ukrainian border. In view of the peripheral and mountainous nature of their area of settlement, their internal migration began as early as the mid-20th century, principally targeting the lowland areas. As a consequence of this development, over the past 20 years their population share has reached 10% in an increasing number of villages, mainly in the Banat region.
The populations of the other, smaller minorities have fallen by a half or a third since the change of regime, owing to emigration and assimilation.
Slovaks still live in the common border areas of Bihor and Sălaj counties (Şes Mountains) and in Nădlac (Arad County). Almost all the
Serbians live in the Banat region, mainly near the Serbian border. Still, their most populous community is to be found in in the centre of the region, in Timişoara.
The villages of the
Krashovani community, members of which are gradually becoming Croatian on account of their Roman Catholic religion, are concentrated in the southern neighbourhood of Reşiţa. Their special settlement pattern (87% of them live in the seven settlements where they form the local majority) explains their demographic characteristics, which are more favourable than those of the other small minorities.
Catholic
Bulgarians fled to the area in 1737−1738, and today they form a majority in just two villages in the Banat region. The great majority of
Czechs, who were settled in the region in the 1820s, live in the small upland villages of the southern part of the Banat region, seven of which still have Czech majority populations.
2.4.5. Vojvodina (Serbia)
Vojvodina is the northernmost province of Serbia and accounts for almost a quarter of the country’s territory. Most of this area was part of Hungary between 895 and 1918 (except for the time of the Ottoman occupation and some of the periods of Habsburg absolutism). Subsequently, it belonged to Yugoslavia between 1918 and 1941 and in the period 1945–2003. Nowadays it enjoys autonomous status and has six official languages.
The population of Vojvodina decreased by 100 thousand persons between 2002 and 2011. Two-thirds of the 1.9 million inhabitants of Vojvodina self-identified as
Serbs, while 13% indicated a Hungarian ethnic identity. Ethnic homogenization is gradually changing the ethnic structure, and so the province is steadily losing its ethnic, religious and cultural diversity, which emerged in the 18th century. In the past ten years, with the exception of the Romani, all ethnic groups have registered a decline in numbers, and the rate of population decline among the minorities – owing to aging populations, assimilation and high emigration rates – has exceeded that of the state-constituting nation. During the 1990s, the number of Serbs in Vojvodina increased by 178,000 (in consequence of an influx of Serb refugees). Since then, however, there has been a decrease of 32,000, owing mainly to emigration, a low rate of natural increase, and an increase in the number of non-respondents to ethnic questions. This decrease, however, was less than had been anticipated. Since 1991 the Serb population share has grown rapidly in economically developed areas along the Belgrade–Novi Sad–Subotica axis, which offer relatively favourable living conditions. Serbs form an absolute majority in Syrmia (Srem), South Bačka and in the southern and central parts of the Banat region. The highest concentrations of Serbs can be found in Novi Sad, Pančevo, Zrenjanin, Sombor and Sremska Mitrovica.
Despite the large-scale emigration of
Hungarians from Vojvodina and a high natural decrease rate, their population stood at 251,000 in 2011. Hungarians form a majority of the population in eight northern communes of the province, where their most populous communities can be found (e.g. in Subotica, Senta, Bečej).
Croats, Bunjevci and
Šokci (previously grouped in the same category on account of their Roman Catholic religious affiliation) together numbered 64 thousand in 2011. One settlement in Syrmia (Srem) and 10 settlements in Bačka, mainly in the environs of Subotica and near the Danube, retain their Croatian and Bunjevci majorities. The Slovak population (50 thousand) has fallen over the past decade, owing primarily to natural decrease. The biggest Slovak communities are in Kovačica and Padina (Banat), in Stara Pazova (Syrmia) and in Bački Petrovac and Kisač (Bačka).
The
Romani population numbers 42 thousand. Most Romani live in the major towns (Novi Sad, Subotica, Zrenjanin, Beočin, Kikinda) or in their vicinity. They also make up a significant share of the population in the central, depopulating borderlands of the Banat region. The
Romanian population (25 thousand) has been falling steadily since 1910, owing to emigration, natural decrease and assimilation. The Romanians live predominantly in southern and central parts of the Banat region, where they still form the largest ethnic group in 17 villages. The most important settlements of the
Rusyns and
Ukrainians are Ruski Krstur and Kucura in Bačka, which were repopulated in the middle of the 18th century. Among the minor ethnic groups, it is worth mentioning the 22,000
Montenegrins (who together with the Serbs constitute one category on the map), who moved to Vojvodina principally under the resettlement programmes in the aftermath of World War II. Their largest community – more than 5,000 persons – is located in Vrbas, but they form a majority of the local population only in the village of Lovćenac in the Bačka region. The
Macedonian population (on the map it features in the “other” category) also came to the region during the Yugoslav era; it is concentrated in the Pančevo area. The very small Czech community in Vojvodina (1,400 persons) is the most western part of the Banat Czech population group; it forms the largest ethnic group in one very small village. One should also mention several non-ethnic-based identity categories which have played – and continue to play – a significant role.
The
Yugoslav ‘ethnic’ category (as a supranational identity category) was extraordinarily successful during the Yugoslav era. Especially in Vojvodina, many people claimed to have a Yugoslav identity (particularly those living in urban areas or with minority backgrounds, as well as the children of mixed marriages) (see Sekulic et al. 1994). Indeed, in 1991, 9% of the population of Vojvodina – or 174,000 people – self-identified as Yugoslavs. Since then, the figure has fallen sharply to 12,000, in consequence of the collapse of the Yugoslav state. At the same time, however,
regional and similarly non-ethnic
ties have strengthened (29,000 persons), above all the ‘Vojvodina’ category. As in other areas of the Carpathian Basin, there has been a significant, but not dramatic, increase in the number of people who choose
not to state their ethnicity (80,000 persons in 2002; 96,000 persons in 2011).
2.4.6. Pannonian Croatia
Only the Central European (Pannonian) part of the Republic of Croatia is located within the Carpathian Basin; two-thirds of the national population lives in this area. The roots of Croatian statehood go back to the 9th century. Although it enjoyed regional autonomy, Croatia was attached to the Hungarian Crown by personal union from 1102 until 1918. Croatia was a part of the Kingdom of Serbs, Croats and Slovenes (from 1929 Yugoslavia) between 1918 and 1941, and it constituted a federal constituent unit of the Socialist Federal Republic of Yugoslavia between 1945 and 1991. In the 20th century, Croatia was an independent country between 1941 and 1945, and again after 1991. At the time of the medieval Kingdom of Hungary, the western two-thirds of what is today the Pannonian part of Croatia were called Slavonia, while the eastern third of the area constituted a part of Hungary proper.
In the 1990s the most significant ethnic-related changes in the Pannonian part of Croatia (which today has a population of 2.9 million) were the departure of more than half of the Serb population and a strengthening of national identity. In consequence, the ethnic structure of the country, with its declining population, became significantly more homogenised, a process which continued at a considerably more moderate rate in the 2000s. The population of each of the traditional minorities declined; only the Romani ethnic group and some Muslim groups (e.g. Albanians and Bosnians) registered population increases.
The population of the ethnic
Croats, which had grown in the 1990s with the arrival of refugees from Bosnia and Herzegovina, fell over the past decade in the Pannonian part of the country by 100,000 to 2.6 million. Their settlement area, which had expanded significantly at the time of the Yugoslav Wars (mainly to the detriment of the Serbs), declined somewhat in size between 2001 and 2011, following the partial return of the
Serb population. According to the 2011 census, most of the Croats in the Pannonian Croatian areas live in Zagreb, Osijek, Sesvete, Slavonski Brod and Karlovac. In the past two decades, the Serb population fell by two-thirds, or 131 thousand. This was the toll of the war of 1991–1995 and the ensuing migrations. Recently, an additional factor has been an aging population. The turbulent events of the 1990s had a lesser effect on the Serb population in the eastern areas bordering Serbia, all of which were returned to Croatian jurisdiction by 1998. The most populous Serbian communities in Pannonian Croatia can be found in Zagreb, Vukovar, Osijek, Borovo and Karlovac.
Most of the
Hungarians (13 thousand persons) live in Baranja and in Eastern Slavonia (south of Osijek). Croatia is also home to communities of
Bosniaks and ethnic
Muslims, most of whom came to the country in recent decades. They live principally in Zagreb or its environs, in Sisak, and in the border areas near Bosnia. The
Czech population has decreased significantly during recent decades, having also been affected by accelerated assimilation. Most Czechs live in West Slavonia (mainly in the vicinity of Daruvar and Grubišno Polje), where they constitute the ethnic majority in 16 villages. The four thousand
Slovaks and the three thousand
Rusyns live in Eastern Slavonia; both communities form a majority of the population in just two villages. The
Romani community (15,000 persons) live mainly in the Međimurje region and the Varaždin area. Their segregation is well illustrated by the fact that in the past decade three Romani settlements have become independent villages, with Romani people making up 92–100% of the local population.
2.4.7. Transmura Region (Slovenia)
The region (Prekmurje in Slovenian, Muravidék in Hungarian) covers less than 5% of Slovenia’s territory; it is located in the northeastern part of the country. The Transmura Region, which is situated in the southwestern corner of Pannonia (Transdanubia), formed part of Hungary between 900 and 1919 and again from 1941 until 1945. It was ceded to the newly established Kingdom of Serbs, Croats and Slovenes (later Yugoslavia) in 1919 (1920). Held in 2002, Slovenia’s first census was also the last to gather ethnic data, for the country has switched to a register-based census. At the time of the 2002 census, 85% of people in the region self-identified as ethnic Slovenes, while 6.6% indicated a Hungarian ethnicity. The
Slovenian ethnic area covers almost the entire Transmura Region, the only exception being a part of the Hungarian borderland. Three-quarters of the Slovenes live in the lowlands. Their most populous communities are: Murska Sobota, Beltinci, and Lendava. The
Hungarian population (most Hungarians live in the Hungarian–Slovenian border area) fell to almost a third of its previous level after World War II. Their most populous communities are to be found in Lendava and in Dobrovnik. The
Croatians came mainly from the neighbouring Međimurje region and found new homes primarily in Lendava and Murska Sobota.
Romani tend to reside in the ethnically mixed border area. Still, the only majority Romani settlement (Pušča) is to be found near Murska Sobota.
10
2.4.8. Burgenland (Austria)
Burgenland, the easternmost and youngest province of Austria, accounts for less than 5% of the country’s territory. This West Pannonian area was an integral part of Hungary between 900 and 1921, when the new Austrian province was established, following the peace treaties of Saint-Germain-en-Laye (1919) and Versailles (Trianon, 1920). Similarly to Slovenia and for the same reasons, Austria has chosen not to hold a traditional census since the turn of the millennium. According to the 2001 census, 87% of Burgenland’s inhabitants, who number more than quarter of a million, declared
German to be their language of everyday use. The number of German-speaking people has increased since 1991, owing to the assimilation of Croats and Hungarians. Even so, their population share has decreased with the influx of foreigners. All settlements in the area (except for 25) have a German majority. The most populous German-Austrian communities are those of Eisenstadt, Neusiedl am See, Mattersburg and Oberwart. As a result of Croatian immigration, the population of the
Croatian community is growing slowly. Today, villages with a
Croatian majority (altogether 23 settlements) make up an ethnic block only in the eastern part of the Oberpullendorf District. Despite large-scale
Hungarian immigration, the number of Hungarians in Burgenland is declining, owing to the rapid natural decrease of autochthonous Hungarians and to linguistic assimilation. Their most populous communities are to be found in Oberwart, Oberpullendorf and Unterwart.
3. Ethnic patterns of the neighbourhood areas
3.1. Austria
The part of Austria lying to the west of Burgenland and shown on the map is Lower Austria and Styria. At the time of the census in 1880, there were three Czech majority villages in Lower Austria and three Slovenian majority villages in Styria. Other parts of the study area constituted a German-speaking homogeneous settlement area. The Czech language islands became Germanized by the beginning of the 20th century, while the assimilation of Slovenes living in the Austrian–Slovenian contact zone took somewhat longer. However, only a thousand Slovenes lived in the Austrian part of Styria according to the census of 1934.
This homogeneous ethnic structure underwent change with the arrival of economic migrants from the Balkans and Turkey in the 1960s, when Austria became a migration destination. Consequently, in the study area there are hardly any autochthonous minority communities but a significant number of immigrant communities (in 2014 630 thousand immigrants live in Vienna alone). These minorities (mainly South Slavs and Turks) live primarily in Vienna and the surrounding area and in other cities, but their share of the population is less than 25% everywhere.
3.2. Czech Republic
In the 19th century three significant national groups – Czechs, Germans and Poles – lived on the territory of what is today the Czech Republic. At the 1880 census, the Czech majority settlements were situated in the central part of historical Bohemia and Moravia and near the Moravian–Hungarian border. The German settlement area lay in the mountainous and highland areas surrounding the Czech and Moravian Basins. A particularly high proportion of them lived in Silesia. Further significant German populations could be found in the environs of Jihlava (Iglau) and in the major towns (e.g. Brno/Brünn, Olomouc/Olmütz). A significant proportion of these urban German-speaking inhabitants adhered to Judaism. The third major ethnic group, the Poles, lived in concentrated areas away from the Czechs, along the present-day Czech–Polish border, around Český Těšín (Teschen). On the whole, ethnic segregation was rather significant in the study area: the ethnic groups were relatively sharply separated from each other (there are only some German language islands on the map). Indeed, the share of mixed-population settlements (with a local minority population of more than 10%) was less than 5%.
The ethnic structure of the area shown on the map did not change substantially until the dissolution of the Austro–Hungarian Monarchy: the population share of Czechs was around 73–74%, Germans 22–23%, and Poles 2–3%. Until 1910, homogenization usually took place inside ethnic blocks (this applied to both Czech–German and Czech–Polish relations). The local majorities of some ethnically mixed settlements in the contact zone changed. The most significant of such changes related to the majority population in Olomouc (Olmütz), which became Czech.
This relatively stable ethnic structure underwent a significant transformation after the formation of Czechoslovakia, when Germans became a minority. Shifts in the balance of power are clearly reflected in changes in the ethnic structure. By 1930, the Czech population share had increased in settlements in what had been the German blocks and in the whole study area (81–82%). Further, the number of settlements with a Czech majority grew in the southern part of Moravia and in the Czech–Moravian Highlands. The greatest changes took place in the environs of Znojmo and Jihlava. In three South Moravian villages which had been populated by Croatian refugees in the 16th century, the majority of inhabitants (who, at the Austrian census of 1910, had declared German to be their spoken language) self-identified as Croatian again in 1930.
The events of World War II radically altered the ethnic relations. The deportation of German- and Czech-speaking Jews was followed by the expulsion of the ethnic German population between 1945 and 1948 and of the Croats (branded “Germanophiles” and unreliable) between 1948 and 1950. This enabled, in the aftermath of World War II, the realization of a homogeneous Slavic nation-state. In consequence of domestic migration, the German population was replaced primarily by Czechs and Slovaks, but 44 thousand Hungarians from South Slovakia were also deported for nationalist reasons. In the surroundings of Český Těšín, the Poles gradually became minorities in their own settlements. By 1961 they constituted a majority only in some smaller, peripheral settlements.
In the communist era, the ethnic structure outlined above did not change essentially. The number of migrant Slovaks grew in areas near Slovakia and in the cities and industrial centres of the Czech lands. Even so, their population share exceeded 10% only in some small villages. Conversely, the number and share of the Poles gradually decreased, and so they had become a minority everywhere by the end of the period.
The most important new feature of the census in 1991 was that even a regional identity (e.g. Moravian, Silesian) could be chosen.
11 Moravian ethnic affiliation was declared by a very large number of people (nearly 1.4 million people nationwide, which amounted to 13% of the population).
Still, the most spectacular development since 1990 has been an increase in the share of the population not declaring any ethnic affiliation. While the significance of regional identities, which are typical in this area, declined during this period (this is still not shown in the map series – 1991: 1.4 million; 2001: 400 thousand; 2011: 530 thousand), the number of people who did not declare any ethnic ties grew from 20 thousand to 2.7 million. This is a quarter of the population of the Czech Republic. In 2001 and 2011, the Czech census – similarly to the Hungarian and Polish censuses – has allowed people to indicate multiple identities. In 2011, most people who made use of this opportunity self-identified as Czech–Moravian or Czech–Slovak. Nationally, more than 100,000 people (2.4% of the population) declared such dual affiliations. In consequence of the aforementioned developments and the methodological innovations, in 2011 only 60% of the population of the area shown on the map self-identified as ethnic Czechs, while 14% of them, a percentage that far exceeded the national average, indicated one or other regional identity on the questionnaire (including almost 100,000 people with dual Moravian and Silesian identity). Since democratisation, the Slovak community has halved in size (59,000 persons) and lives principally in urban areas and in scattered villages close to the Slovak border. The Czech–Polish border region is home to the Polish population, which has been assimilating and declining in size (from 42,000 in 2001 to 30,000 in 2011). In their area, the number of people of unknown ethnicity exceeds 1 million (24%); non-respondents form a majority of the population in 31 settlements.
3.3. Poland
The largest part of Poland shown on the map had a Polish ethnic majority as early as in 1880 (78–79%). Most of the German population – their population share was about 3–4% until World War I – lived in Silesia and in the neighbouring Galician areas (e.g. in Bielsko/Bielitz and in the surrounding area). The settlement area of the Rusyns spread east from Nowy Sącz (Neu Sandez) and was limited mainly to the Carpathians; their population share was 18–19% in the study area. The relatively sharp line between the Polish and Rusyn/Ukrainian ethnic areas ran along the foot of the Carpathians and then to Przemyśl. East of this line, which marked the end of the Polish ethnic area, there were a majority of Polish native speakers even in Rusyn majority areas. Additional important groups in the towns of West Galicia were German- and Polish-speaking Jews.
Until the turn of the 20th century, there were no significant changes in the ethnic spatial structure outlined above. However, boundary changes after World War I and shifts in the balance of power resulted in significant changes in this area too. In Poland, a country that regained its independence at this time and managed to expand its territory, the census in 1921 already recorded an increase in the number of Poles, albeit their population share stagnated, owing to the introduction of a separate Jewish ethnic category at the census. This was offset by a decline in the number and share of Germans in Silesia and in the number and share of Rusyns in the Polish–Rusyn contact zone.
The aforementioned Jewish ethnic or religious group constituted almost 4% of the population. The Jewish communities were to be found primarily in the eastern part of present-day Poland. In World War II most of Poland’s Jews were killed, and after 1945 the country’s German inhabitants were deported. As a consequence of Polish–Ukrainian hostility, a Polish–Soviet (Ukrainian) population exchange took place.
12 It affected several hundred thousand persons in the periods 1944–1949 and 1955–1959 (Eberhardt 1994; Kosiński 1964). Further, Ukrainians who were still living within Poland’s new borders were resettled in the course of “Operation Vistula” in the newly annexed western and northern areas (
Gawryszewski 2005). As a result of forced migrations, an ethnically homogeneous Polish nation-state came into being after 1945.
Under communism, only estimates of Poland’s ethnic structure were published (Eberhardt 1996). Consequently, ethnic data have only been collected at censuses since the turn of the millennium. Between 2002 and 2011, ethnic developments in Poland were similar to those observed in Hungary and in the Czech Republic. The decrease in the ethnic Polish population was offset by an increase in the minority populations (including people of dual identity) and an increase in the number of people of unknown ethnic identity. Even so, given that Poland’s 2011 census shows ethnic data only at the district level and in fragmentary form, we have accurate information on the southern Polish region (featured on our map), including the ethnic structure of various settlements, based exclusively on the census of 2002. According to the 2002 census, around four thousand people declared themselves to be Ukrainians/Rusyns in the southern areas of Poland shown on the map; these people mainly inhabit remote villages in the Carpathians. Every third Ukrainian in Poland was a Polish native speaker in 2002, which reflects their advanced assimilation. In addition, it is worth mentioning that the depopulation of villages is a significant factor in the mountainous and hilly regions that constituted the former Rusyn ethnic area. In summary, the Polish part of the study area has a homogenous Polish population and the minorities make up a negligible part of the total population.
3.4. Ukraine
In 1880 the inner part of present-day Ukraine, the region to the east of the Carpathians, was shared by two empires (the Austro–Hungarian Monarchy and Russia). In the parts of this region belonging to the Russian Empire, no ethnic data are available at settlement level until World War II.
In East Galicia, which covers a significant part of the west of present-day Ukraine, three main ethno-linguistic groups (Rusyns, Poles and Germans) were living in 1880. Rusyns made up two-thirds of the population, and yet only the Carpathians were considered to be a homogeneous Rusyn-inhabited area. Poles accounted for a quarter of the population, and they were settled in a mosaic-like fashion throughout Galicia. They formed a majority of the population in the cities (e.g. Lviv/Lemberg, Ivano-Frankivsk/Stanislau) and in their environs. A large number of Poles were also to be found in East Galicia.
13 Generally, in their settlement area the villages and towns had mixed populations of Rusyns and Poles (Greek and Roman Catholics, as well as Jews). The various groups lived together, and so we cannot speak of the separation of these two ethnic groups. German native speakers (6–7%) were the third major community in Galicia, and the community consisted of several sub-groups: the Jews lived primarily in towns, while the Roman Catholics and Lutherans lived in towns and in German villages founded mainly in the 19th century (
Langhans 1919).
In 1880, in the northern part of Bukovina, which today belongs to Ukraine, a rather mixed ethnic pattern developed, which, however, was stable until the end of World War I. Alongside the Rusyn majority, there were large numbers of Romanians, Germans, Poles and Russians (Lipovans) in this region. In the northern and western parts of the area, Rusyns formed the majority, while in the southern and eastern ones Romanians did so.
Galicia is one of the few regions where there were significant changes in the ethnic spatial structure between 1880 and 1900. The reason for this, however, is to be found not in the migrations or differences in natural increase but in the changing ethno-linguistic self-identification of the Rusyn, Polish and German groups that had uncertain or multiple affiliations. In certain settlements, whole communities alternated their ethnic affiliation from census to census – regardless of whether they were Roman or Greek Catholics (or perhaps Jewish). This means that in Galicia denominational and ethno-linguistic boundaries did not overlap. Although the Austrian censuses (1880, 1890, 1900) indicate several precedents for Rusynization, a radical increase in the Polish population share was a consequence of the lingual assimilation of German(Yiddish)-speaking Jews and Rusyns.
After World War II, when Galicia became a part of Poland once more, ethnic assimilation became multidirectional. The status of the Poles as the ruling nation exerted a strong pull on Rusyns with multiple ethnic identities. Consequently, the Rusyn population share fell to around 50% in the study area. Further, a similar degree of Polonization was observed among the German Catholic population that had come to Galicia in the 19th century. However, the number and share of Poles did not increase between 1910 and 1921, as the Jewish ethnic category had been introduced, and some 300 thousand (7%) self-identified as Jews.
In the same period, Bukovina and Bessarabia were attached to Romania, resulting in an increase in the number of Romanians. The Romanization of Rusyns was a significant factor primarily in the Romanian–Rusyn contact zone. At the Romanian censuses, just as in Poland, the Jewish ethnic category was introduced, which was significant in the centre of the region, in Chernivtsi (Cernăuţi). According to the Romanian census of 1930, a Russian ethnic block was also to be found to the south to Hotin in the part of Bessarabia that forms the Romanian–Ukrainian contact zone and lies between the Dnester and Prut rivers.
In World War II, in North Bukovina and Bessarabia (under Romanian jurisdiction from July 1941) and in Galicia (which had been occupied by Germany), the Jewish population was deported to the extermination camps. The withdrawal of German troops was accompanied by the flight of Germans from Galicia and North Bukovina. After a new border was drawn between Poland and the Soviet Union, hundreds of thousands of Poles were resettled in Poland, whose territory had been pushed to the west. In consequence, only 360 thousand Poles remained in Ukraine in 1959 (Eberhardt 1994). Owing to assimilation, the native language of 85–90% of them is Ukrainian or Russian today (Lagzi 2009). According to the Ukrainian census of 2001, only 30 thousand (0.6%) ethnic Poles and 14 thousand Polish native speakers live in the area shown on the map. Their most significant concentration (more than 5% of the total population) may be found in Mostys’ka (Oblast L’viv) raion. The ethnic Russian population (110 thousand, 2.2%; Russian native speakers: 180 thousand, 3.2%), who settled in the area under communism, is concentrated in the urban centres. Ethnic homogenization was a minor factor in North Bukovina. Although the Ukrainian−Romanian language border has shifted somewhat southwards, a significant community of Romanian native speakers (170 thousand, 3%) lives near the Romanian border. In addition, a Russian (Lipovan) and a Polish majority village may be found in the area.
3.5. Romania
For the period before 1930 there are no ethnic data at the settlement level for the parts of present-day Romania that lie to the south and east of the Carpathians (the Old Romanian Kingdom, or ”Regat”). The only exception is South Bukovina, which belonged to the Austro–Hungarian Monarchy until 1918. Thus, the only available information comes from the relatively small-scale ethnic maps of the period (
Cvijić 1913;
Ischirkoff 1915). Such maps show that alongside the majority Romanian population there were also Bulgarian diasporic populations in Wallachia and a Hungarian Roman Catholic population (the Csángó people) in Moldova.
In 1880, South Bukovina had a far more diverse ethnic population than the one described above. Alongside the Romanian majority, there was a stable Rusyn ethnic area on the slopes of the Eastern Carpathians. The German native speakers could be divided into two groups: first, the majority population of Jewish religion in the towns of Siret (Sereth), Suceava (Suczawa) and Rădăuţi (Radautz); second, mainly mining populations of Roman Catholic religion in the western highlands (e.g. Cârlibaba). In addition, five Hungarian, four Polish and two Russian (Lipovan) villages added to the ethnic-lingual diversity of the region.
On the basis of the 1930 census, a complete picture may be drawn of the ethnic situation in Romania. The Romanian population constituted a nearly homogenous majority in the “Regat”. The Roma constituted the only other sizeable group in Wallachia (approx. 27 thousand), while in Moldova (in addition to the Romanians) there were several Csángó-Hungarian communities, as well as, Russians (Lipovans), Roma, and Jews. The latter lived mainly in urban areas. Nevertheless, the total proportion of minorities in the Regat was only around 5%.
By 1941, the extent and share of the minority population continued to fall in the area under study. This was a consequence both of assimilation in the preceding decades and of migration during the war (e.g. the transfer of the Szekler-Hungarians of Bukovina to Bačka). Therefore, alongside a large Romanian majority, only some Ukrainian, Polish, Russian, Jewish and German settlements can be seen on the map extract (living mainly in Bukovina and in Moldova).
Under communism, the assimilation of the minorities continued. Minority populations were still to be found in the greatest concentration in Bukovina (Ukrainians, Poles and Russians). An important phenomenon in the post-Communist era and especially after the turn of the millennium was a significant population decline – a result of emigration and of people going to work abroad. In recent decades, in addition to ethnic homogenization, there has also been a degree of ethnic diversification with a sharp increase in the number of Roma, who form the only significant minority group (178 thousand, 2.3%) in these areas. Even so, in the Bukovina region (Suceava and Botoşani counties), the Ukrainian, Russian and Polish populations are still sizeable, forming majorities in 11, 4 and 3 villages respectively. Owing to the methodological peculiarities of the censuses, almost half a million people (6.4%) are of unknown ethnicity in the area under examination.
3.6. Serbia
The areas in Central Serbia shown on the map have belonged to Serbia (or have been under Serbian control) throughout the period under investigation (i.e. since 1880). As a consequence, geopolitical changes have had only a minor effect on the ethnic structure here.
At the Serbian census of 1890, the western part of this area was inhabited predominantly by Serbs, with some sporadic mixed Bosniak-Serbian villages and semi-nomadic Roma communities. In contrast, to the east of the Morava River, in the Serbian Carpathians, the settlement areas of Serbs and Romanian-speaking Vlachs overlapped, and near the Romanian border Romanian native speakers constituted the majority. Their estimated number was about 80 thousand in the area shown on the map.
As the Vlach ethnic group never lived under Romanian jurisdiction, they were untouched by the Romanian nation-building process. This explains their significant assimilation from the 19th century onwards (
Ružica 2006). The process was enhanced by the fact that Vlachs belonged to the Serbian Orthodox Church. As a result, after World War II the number of people declaring Vlach ethnicity and mother tongue radically decreased. While 199 thousand considered themselves to be Vlach native speakers in 1953, by 1961 only 1330 self-identified as Vlachs.
However, an ethnic revival among Vlachs can be seen from the end of the 20th century (
Ružica 2006), resulting in an increase in their population: according to the 2011 census, 35 thousand people (0.5%) self-identified as Vlachs. The only other significant minority in the area is the Romani population (105 thousand, 2%). Two-thirds of the Vlach population (around 13,000 people) live in the area under examination; they constitute the largest ethnic group in 25 settlements. Apart from them, Roma people are the only other group of significant size (45,000) in the area. Half of them live in Belgrade (and they form a majority of the population in just one settlement). One should also note the presence of up to 100,000 people who chose to refrain from stating their ethnicity on the census questionnaire.
3.7. Bosnia és Herzegovina
Bosnia and Herzegovina was a province of the Austro–Hungarian Monarchy after the occupation of 1878. According to the census of 1879, several ethnic–denominational groups lived here (alongside each other rather than mixed together). Serbs (Orthodox) constituted half of the population living in the area shown on the map. They formed a compact ethnic territory primarily in the western part of Bosnia. The second major community was that of the Bosniaks (Muslims) (37%), whose pattern of settlement was the least concentrated in the province. Their area of settlement can be divided into two main parts: to the west of the Bihać–Krupa line in the west, and between Doboj and Zvornik in the east. Further, it can be stated that in general most of the towns had a Bosniak majority. The ethnic area of the Croats (Catholics, 76 thousand, 12%) was isolated; their greatest concentration lay between Derventa (Dervent) and Brčko (Brčka).
Beside these three autochthonous ethno-religious groups, some new ones appeared from the end of the 19th century. Motivated primarily by the availability of agricultural land, these people came to Bosnia and especially to its northern part, where the population density was still relatively low. Villages, or colonies, were populated at the time by small ethnic groups (in order of size: Germans, Poles, Rusyns, Hungarians and Czechs; 3–14 thousand, 4% of the total population).
After World War I, the province became part of the Kingdom of Serbs, Croats and Slovenes. In the period between 1880 and 1930 and despite the absence of any essential changes in the ethnic spatial structure, a significant shift in the relative population shares took place among the ethnic groups. In the study area, the Serbs and Croats increased their shares (to 52% and 16%), while the Bosniaks’ population share dropped to 28%. In World War II, non-Slavic colonists left the area, and then in the years after the war Poles also repatriated (
Vranješ-Šoljan 2007). The other significant change was the establishment of the ’Yugoslav’ ethnic category at censuses, which became quite popular among Muslims. Between 1961 and 1991, the increases in the number and proportion of Bosniaks (Muslims) were especially high because of the higher degree of emigration and the lower fertility rate of the Serbs and Croats (
Bottlik 2010).
The Yugoslav census in 1991 took place immediately before the civil war; accordingly, the number of “ethnic Yugoslavs” (who belonged to none of the various opposing forces) drastically fell. In the course of a century those minorities that had settled in the area since the end of the 19th century became almost fully assimilated. At the same time, a new phenomenon was the considerable increase in the Romani population. The share of Bosniaks increased to 43%; on the other hand, the share of Serbs fell to 36% and that of Croats to 13%.
This mosaic-type ethnic pattern was altered by the civil war in 1992–1995, which established ethnically nearly homogeneous entities and administrative units. At the time of writing, the ethnic data of the Bosnian census of 2013 remain unknown, but the various estimates give a very similar picture about the ethnic composition of the communes (općina) (which we have also shown on the census map for the ethnic boundary). Inside the country the boundary between the two entities has essentially become the ethnic border: all the communes on the territory of the Republika Srpska and included on our map have Serb majorities, while the communes of the Federation of Bosnia and Herzegovina have Bosnian or Croatian majorities, with the exception of the four communes with Serb majorities that lie to the southeast of Bihać between the Republika Srpska and Croatia. In general, the communes are ethnically homogeneous; in the area under inquiry only 14 of 81 communes have mixed populations.
3.8. Slovenia
In the part of present-day Slovenia that lies to the west of the Mura river and is shown on the map (roughly, historic Lower Styria, Slovenian Štajerska), the only significant minority group were the Germans (they constituted about 11% of the population in the study area). They lived primarily in one block near the present-day Slovenian–Austrian border, west of Gornja Radgona (Apaško polje). Another group of Germans inhabited the towns, where they constituted the local majority (e.g. Maribor/Marburg, Ptuj/Pettau). Until 1910, an increase in the share of Germans could be observed in the ethnic contact zone (from 11 to 15%).
The change of state authority in 1918 reversed this trend: the number of Germans living inside the Slovenian ethnic area radically decreased, and they became a minority everywhere. The number of Germans living alongside the Austrian border also fell (from 3.5 thousand to 2.5 thousand), and yet they still formed a majority in twenty villages. In 1945, Germans living in the area either fled or were deported. Thus, Slovenian Styria became an almost homogeneous ethnic Slovenian area. Ethnic diversity increased with the arrival in the urban areas of Serbs, Bosniaks and Croats; however, their total population share was still less than 2% in 2002.
____________________
1 In our interpretation, the settlement is the smallest territorial unit that is still presented at censuses and in the statistics of certain countries. Urban districts of a city are not considered settlements.
2 In Romania, settlement boundaries are absent below the level of the commune (commună). Thus, in Transylvania the settlement boundaries of the Hungarian period are displayed on maps, while settlements outside the Carpathian Basin are not separated by boundaries where they lie within a single commune.
3 We merged into the ‘other’ category ethnic groups with a share of less than 1% in settlements with more than 500,000 inhabitants, with a share of less than 2% in settlements with 25–500,000 inhabitants, and with a share of less than 3% in settlements with fewer than 25,000 inhabitant.
4 On the use of colours in ethnic maps and their visual effects, see Keményfi 2004. 120–140.
5 The calculation is based on the estimated population by counties (KUBINYI 1996) followed by a division of the sums among the ethnic groups according to the estimated ethnic majority of the settlements by counties..
6 The calculation is based on the estimated population by counties (KUBINYI 1996) followed by a division of the sums among the ethnic groups according to the estimated ethnic majority of the settlements by counties.
7 In seven additional settlements, non-respondents outnumber those responding to the ethnicity question.
8 Based on the migration data, the only conclusion that may be drawn is that the population of Transcarpathia was stagnating in the pre-conflict period, in consequence of a rate of natural increase that was higher than in other areas of Ukraine but still close to 0. The values in the districts populated by ethnic Hungarians were somewhat lower than those in the upland districts (see MOLNÁR and MOLNÁR 2005).
9 At the same time, Ukrainian statistics still place native Rusyn speakers among the Ukrainians, distinguishing between the two groups only in the counties of Lviv and Transcarpathia.
10 On the map, the settlement is part of Černelavci, as it became an independent entity only after 2002.
11 This is not shown on the map, as we did not regard regional identities as separate ethnic categories anywhere; thus, Moravians and Silesians are listed in the ’Czech’ category.
12 The activity of the Ukrainian Insurgent Army (UPA), which fought against the Germans, Soviets and Poles, played a significant part in this process.
13 It is striking, however, that throughout Galicia a majority of the urban population self-identified as Polish even in Rusyn areas.
Balbi A.–Czirbusz G. 1899. Egyetemes földrajz a művelt közönség számára. 5/1. köt. Nagybecskerek, Pleitz Ferenc Pál.
Ballagi K.–Király P. 1878. Egyetemes földrajz, tekintettel az országok természeti, politikai és társadalmi ... viszonyaira. 3. köt. Pest,
Athenaeum.
Bendefy-Benda L. 1932. A magyar föld szerkezete. Pécs, Erzsébet Tudományegyetem Földrajzi Intézete.
Benigni von Mildenberg, J.H. 1837. Handbuch der Statistik und Geographie des Grossfürstentums Siebenbürgen, Hermannstadt.
Bottlik Zs. 2010. Az etnikai térfolyamatok háttere Bosznia-Hercegovinában. Földrajzi Közlemények 134. 4. 443–461.
Braham, R.L. (szerk.) 2007. A magyarországi holokauszt földrajzi enciklopédiája. 1–3. köt. Budapest, Park Kiadó.
Braun L.–Csernicskó I.–Molnár J. 2010. Magyar anyanyelvű cigányok/romák Kárpátalján. Ungvár, PoliPrint.
Bulla B.–Mendöl T. 1947. A Kárpát-medence földrajza. Budapest, Országos Köznevelési Tanács.
Cholnoky J. 1918. Magyarország hegy-, vízrajza és települései. In: Lóczy L. (szerk.): A Magyar Szent Korona országainak földrajzi,
társadalomtudományi, közművelődési és közgazdasági leírása. Budapest, Kilián.
Cholnoky J. 1929. Magyarország földrajza. Pécs, Danubia Könyvkiadó.
Creţan, R.–Turnock, D. 2009. The Gypsy Minority in Romania: A Study in Marginality. Romanian Journal of Geography 53. 1. 33–56.
Csepeli, Gy.–Simon, D. 2004. Construction of Roma Identity in Eastern and Central Europe: Perception and Self-identification. Journal of Ethnic and Migration Studies 30. 1. 129–150.
Cvijić, J. 1913. Die ethnographische Abgrenzung der Völker auf der Balkanhalbinsel. Petermanns Geographische Mitteilungen 59.
113–118.
Csapodi Cs. 1942. Az északnyugati magyar–tót nyelvhatár megváltozása és a katolikus restauráció. Budapest, Szerző.
Danyi D.−Dávid Z. 1960. Az első magyarországi népszámlálás (1784−1787), Budapest, KSH.
Dányi D. et al. 1975. Pótlás az első magyarországi népszámláláshoz 1786−87, Budapest, KSH.
Demian, J.A. 1806. Darstellung der Oesterreichischen Monarchie nach der neuesten statistischen Beziehungen Bd.IV. (Statistische
Beschreibung der Militär-Gränze), Wien.
Durst J. 2010. „Gondolom, hogy cigányok... ennyi gyerekkel...”: etnicitás és reprodukció két észak-magyarországi romungro közösség példáján. In: Feischmidt M. (szerk): Etnicitás. Különbségteremtő társadalom. Budapest, Gondolat–MTA Kisebbségkutató Intézet. 173–194.
Eberhardt, P. 1994. Liczba i rozmieszczenie ludności polskiej na Ukrainie w XX wieku. Czasopismo Geograficzne 65. 2. 125–163.
Eberhardt, P. 1996. Miedzy Rosją a Niemcami. Przemiany narodowościowe w Europie Środkowo-Wschodniej.... Warszawa, Naukowe
PWN.
Fassmann, H.–Musil, E.–Bauer, R.–Melegh, A.–Gruber, K. 2014. Longer-Term Demographic Dynamics in South-East Europe: Convergent, Divergent and Delayed Development Paths. Central and Eastern European Migration Review 3. 2. 150–172.
Fényes E. 1842. Magyarország statistikája. Pest, Trattner–Károlyi.
Gawryszewski, A. 2005. Ludność Polski w xx wieku. Warszawa, PAN Instytut Geografii i Przestrzennego Zagospodarowania.
Gyurgyík L. 2014. A szlovákiai magyarság demográfiai folyamatai 1989-től 2011-ig. Különös tekintettel a 2001-től napjainkig tartó időszakra. Somorja, Fórum Kisebbségkutató Intézet.
Hablicsek L. 2008. The Development and the Spatial Characteristics of the Roma Population in Hungary Experimental Population Projections till 2021. Demográfia 51. 5. 85–123.
Hunfalvy J. 1863. A Magyar Birodalom természeti viszonyainak leírása. 1. köt. Pest, Emich.
Ischirkoff, A. 1915. Das Bulgarentum auf der Balkanhalbinsel im Jahre 1912 (1:1.500.000). Petermanns Geographische Mitteilungen
61. Tafel 44.
Jordan, P.–Kocsis, K.–Eberhardt, P.–Lozovanu, D.–Mironjuk, V.–Partl, F.–Šabilj, O. 2006. Ethnisches Bewusstsein in Mittel- und
Südosteuropa um 2000 (1:3.000.000). Atlas Ost- und Südosteuropa 2.9-G9. Wien, Österreichisches Ost- und Südosteuropa
Institut.
Kalmár G. 1932. Magyar hazánk és népei. Budapest, Szent István Társulat.
Kapitány B. 2013. Kárpát-medencei népszámlálási körkép. Demográfia 56. 1. 25–64.
Katus L. 1988. Nemzetek és népszaporulat. In: Glatz F. (szerk.): Magyarok a Kárpát-medencében. Budapest, Pallas Lap- és Könyvkiadó.
171–174.
Kemény I.–Janky B. (szerk.) 2003. A cigány nemzetiségi adatokról. Kisebbségkutatás 12. 2. 309–315.
Kemény I.–Janky B.–Lengyel G. 2004. A magyarországi cigányság 1971–2003. Budapest, Gondolat Kiadó–MTA ENKI.
Keményfi R. 2004. Földrajzi szemlélet a néprajztudományban: etnikai és felekezeti terek, kontaktzónák elemzési lehetőségei. Debrecen,
Kossuth Egyetemi Kiadó.
Kertesi G.–Kézdi G. 1998. A cigány népesség Magyarországon: dokumentáció és adattár. Budapest, Socio-Typo.
Kiss T. 2012. A 2011-es romániai népszámlálás tanulságai és következményei. Pro Minoritate 2012. ősz. 9–26.
Kniezsa I. 1941. Adalékok a magyar–szlovák nyelvhatár történetéhez. Budapest, Athenaeum.
Kocsis K. 2003. A Kárpát-medence változó etnikai arculata (1989–2002). Kisebbségkutatás 12. 4. 706–714.
Kosiński, L. 1964. Migrations of population in East-Central Europe from 1939–1955. Geographia Polonica 2. 123–131.
Kovács A. 1920. Magyarország népességének fejlődése a török uralom megszűnte óta. In: A magyar béketárgyalások: Jelentés a magyar
békeküldöttség működéséről Neuilly S/S-ben 1920 januárius–március havában. 1. köt. Budapest, Egyetemi Ny. 36–46.
Kovács A. 1925. Nemzetiségi erőviszonyok a történeti Magyarországon. In: Emlékkönyv dr. gróf Klebelsberg Kuno negyedszázados
kultúrpolitikai működésének emlékére. Budapest, Budapesti Hírlap Ny. 615–630.
Kubinyi A. 1996. A Magyar Királyság népessége a 15. század végén. Történelmi Szemle 38. 2–3. 135–161.
Lagzi G. 2009. „Lengyelek, de másak”. Lengyel kisebbségi közösségek a volt Szovjetunió területén és Lengyelország nemzetpolitikája.
Budapest, EÖKK.
Langhans, P. 1919. Nationalitätenkarte von Galizien 1–3. (1:400.000). Petermanns Geographische Mitteilungen 65. Tafel 6., 8., 9.
Leonhard, J. 1818. Lehrbuch zur Beförderung der Kenntniss von Siebenbürgen, Hermannstadt.
Molnár J.–Molnár D.I. 2005. Kárpátalja népessége és magyarsága a népszámlálási és népmozgalmi adatok tükrében. Beregszász, Kárpátaljai Magyar Pedagógusszövetség.
Mušinka, A.–Škobla, D.–Hurrle, J.–Matlovičová, K.–Kling, J. 2014. Atlas rómskych komunít na Slovensku 2013. Bratislava, UNDP.
Nagy L. 1828. Notitiae politico-geographico-statisticae Hungariae, partiumque eidem adnexarum I−II. Buda, Landerer.
Pénzes J.–Pásztor I. Z.–Pálóczi Á. 2015. Cigányság Magyarországon – adatforrások és hátterük. In: Kozma G. (szerk.): Facultates sine finibus Tanulmányok a „Süli-suliból”. Tiszteletkötet: Süli-Zakar István professor emeritus 70. születésnapjára. Didakt Kft., Debrecen. 168–178.
Petrichevich-Horváth E. 1924. Jelentés az Országos Menekültügyi Hivatal négy évi működéséről. Budapest, Pesti Ny.
Preda, M.–Zamfir, C. 2002. Romii în România. Bucureşti, Expert.
Ružica, M. 2006. The Balkan Vlachs/Aromanians. Awakening, national policies, assimilation.
Sekulic, D.–Massey, G.–Hodson, R. 1994. Who Were the Yugoslavs? Failed Sources of a Common Identity in the Former Yugoslavia. American Sociological Review 59. 1. 83–97.
Szabó I. 1941. A magyarság életrajza. Budapest, Magyar Történelmi Társulat.
Szuhay P. 2007. Romakutatások. In: Kovács É. (szerk.): Közösség-tanulmány. Budapest–Pécs, Néprajzi Múzeum–PTE-BTK Kommunikáció- és Médiatudományi Tanszék. 88–103.
Tátrai P. 2015. Transformations of the ethnic structure in Hungary after the turn of the millennium. Human Geographies 9. 1. 79–96.
Teleki, P. 1923. The evolution of Hungary and its place in the European history. New York, Macmillan Co.
Teleki P. 1934. Európáról és Magyarországról. Budapest, Athenaeum.
Thirring G. 1938. Magyarország népessége II. József korában, Budapest, MTA.
Varga E. Á. 1998. Fejezetek a jelenkori Erdély népesedéstörténetéből. Budapest, Püski.
Veres V. 2015. Népességszerkezet és nemzetiség. Az erdélyi magyarok demográfiai képe a 2002. és 2011. évi romániai népszámlálások tükrében. Kolozsvár, Kolozsvári Egyetemi Kiadó.
Virág T. 2006. The regional ghetto. Review of Sociology of the Hungarian Sociological Association 12. 1. 51–70.
Vranješ-Šoljan, B. 2007. Maria Szumska Dabrowska o poljskim doseljenicima u Bosni 1935. Časopis za Suvremenu Povij est 38. 3.
955–965.
Wellmann I. 1989. Magyarország népességének fejlődése a 18. században. In: Ember Gy.–Heckenast G. (szerk.): Magyarország története
1686–1790. Budapest, Akadémiai Kiadó. 25–81.
Zeidler M. 2002. Társadalom és gazdaság Trianon után. Limes 15. 2. 5–24.